AGIX price prediction as SingularityNET token soars

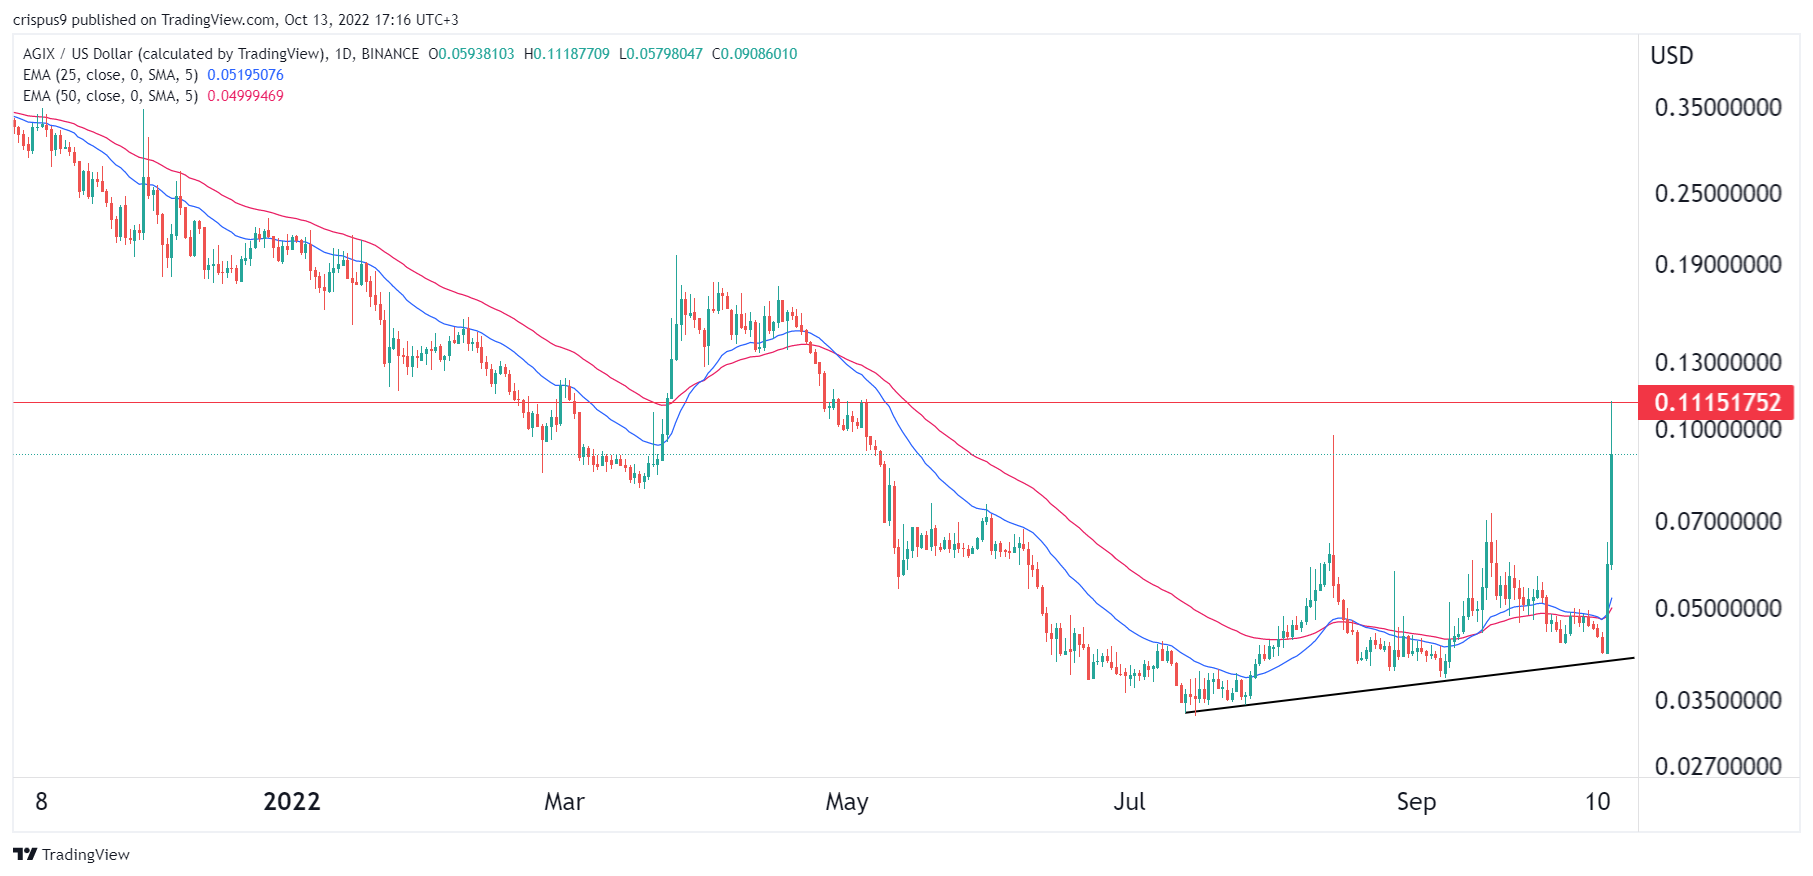
AGIX price soared to a high of $0.1115, which was the highest level since April 28. It has surged by more than 238% from the lowest level in June. According to CoinGecko, its total market cap soared to more than $91 million. SingularityNET jumped even as cryptocurrency prices crashed.
What is SingularityNET?
Artificial Intelligence (AI) is one of the most important technologies in the world. It is used across most industries, including automobile and technology sectors.
SingularityNET is a technology project that seeks to combine the power of artificial intelligence with blockchain technology. The network runs some key products like an AI Marketplace, AI Publisher, and AGIX staking.
Its AI marketplace makes it possible for people to test and buy AI products such as Real Time Voice Cloning, Abstractive Summarisation, Minecraftizing service, and Machine Translation among others.
On the other hand, its AI Publisher project makes it possible for people to build applications that integrate artificial intelligence. AGIX is the native token for the SingularityNET product.
It is unclear why the AGIX price went parabolic on Thursday. A possible reason is that the developers will host a Rare Bloom event this weekend. This is an event that will host a Cardano community network for innovators, builders, entrepreneurs, and creatives.
Therefore, AGIX is rising as investors believe that the coin will do well during this Rare Bloom event. Historically, cryptocurrencies tend to do well ahead of major events.
AGIX’s jump was notable since it happened in a day when most cryptocurrencies are deep in the red. Most coins like Bitcoin, Ripple, and Ethereum prices crashed after the strong American inflation data.
AGIX price prediction

The four-hour chart shows that the SingularityNET price formed a triple-bottom pattern that is shown in black. This is a notable pattern since it is usually a bullish sign. It has moved above all moving averages while oscillators like the Relative Strength Index (RSI) and the MACD continued rising.
Therefore, a move above the important resistance level at $0.1115 will signal that there are still more buyers in the market. If this happens, the next key level to watch will be at $0.1300. A drop below the support at $0.07 will invalidate the bullish view.