Messari report shows BTC volatility fell in Q3
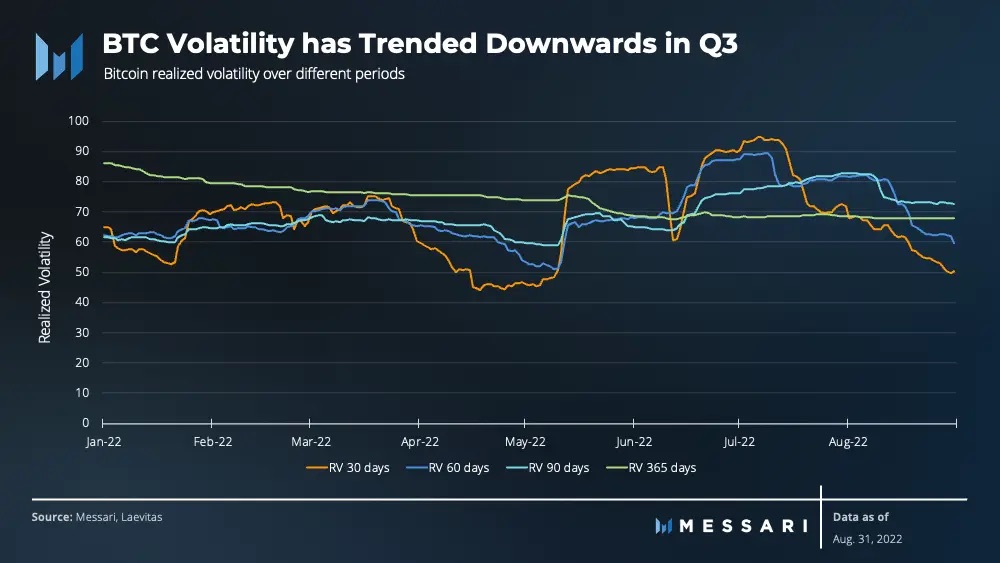
- Bitcoin’s average 30-day volatility in August was 60%, while it stood at 80% in June.
- In 2022, risk asset markets (crypto included) have traded lower and Bitcoin more so like a high-beta US stock.
Bitcoin (BTC) realized volatility during quarter three has trended downwards, according to the latest report on the metric from crypto intelligence and research firm Messari.
Per the research platform, the benchmark cryptocurrency recorded the lower volatility as the crypto saw a slight recovery from June lows.
So while BTC has once again dipped below $20,000 in September, the recovery from the $17,600 levels in June and the retest of key resistances near $25,000 in mid-August was key.
“Bitcoin realized volatility trended downwards as it made a gradual recovery in Q3. Average 30-day volatility for August was 60% compared to over 80% for June,” Messari’s Sami Kassab and Kuna Goel wrote in the State of Bitcoin Q3 2022 report.
 BTC volatility chart showing downward trend in Q3. Source: Messari
The lower volatility for the world’s largest cryptocurrency by market cap saw the broader crypto market record much lower liquidations across the period, the analysts added. For instance, total long liquidations stood at $5 billion in August, a more than 50% drop from the $10.8 billion recorded in June.
As for total short liquidations, the figure fell to $3.5 billion last month, compared to $6.6 billion total liquidations seen in June.
BTC traded like a high-beta US tech stock
As crypto prices see-sawed over the quarter, Messari notes, Bitcoin traded more like a tech stock as it tracked the Nasdaq 100 (rebased).
This happened not just as the federal fund rates increased across the three months, but reflected the rot going back to late 2021. Prior, availability of easy money amid institutional adoption, had helped fuel the bull market.
“For the quarter, the average correlation between Bitcoin and NASDAQ 100 was 0.6 as inflation and rate hikes dominated the narrative. Surprisingly, digital gold and physical gold are far less correlated. The average correlation for the quarter between the two assets was 0.2,” Kassab and Goel wrote.
Overall, Q3 has seen Bitcoin essentially lose two of its key narratives – as an inflation hedge and store-of-value asset – amid the bear market crash that precipitated declines of over 72% since the all-time-highs of 2021.
Bitcoin was trading around $18,910 on Sunday afternoon, about 6% and 13% down over the past 7 days and 30 days respectively.